I ran across an article, Maya Murals: Stunning Images of King & Calendar, which talked about a discovery in Xultún, Guatemala. It was of a dwelling which contained numerous murals painted by the Maya. Thought to be 1,200 years old, it contains some interesting depictions. Especially a picture of three black men, who are apparently wearing white medallions and black headdresses. When I first saw this, I thought: “Why does a Mayan mural have three African men with ivory medallions wearing “Pharaoh” type headdresses?” I am not sure; could it be that the Maya had a special desire to paint themselves black, perhaps like a panther? Or is this evidence of a connection with Africa?
Category: anthropology (Page 3 of 8)

If you enjoyed Joseph Davidovits’ book, Why the Pharaohs Built the Pyramids with Fake Stones, then you will definitely find Margaret Morris’ book, The Great Pyramid Secret to be equally thrilling. In my opinion, it goes into more detail and depth than Davidovits’ book. Both are worth a read.
It’s becoming increasingly clear that their ideas explain the key to the success of the Egyptians in building objects from diorite, hard limestone, quartizite, etc… The simple, but elegant solution of Geopolymers.
I think Jean-Pierre Houdin’s theory about the spiral ramp would be perfect, except change his theory from carved rocks to agglomerated stones.

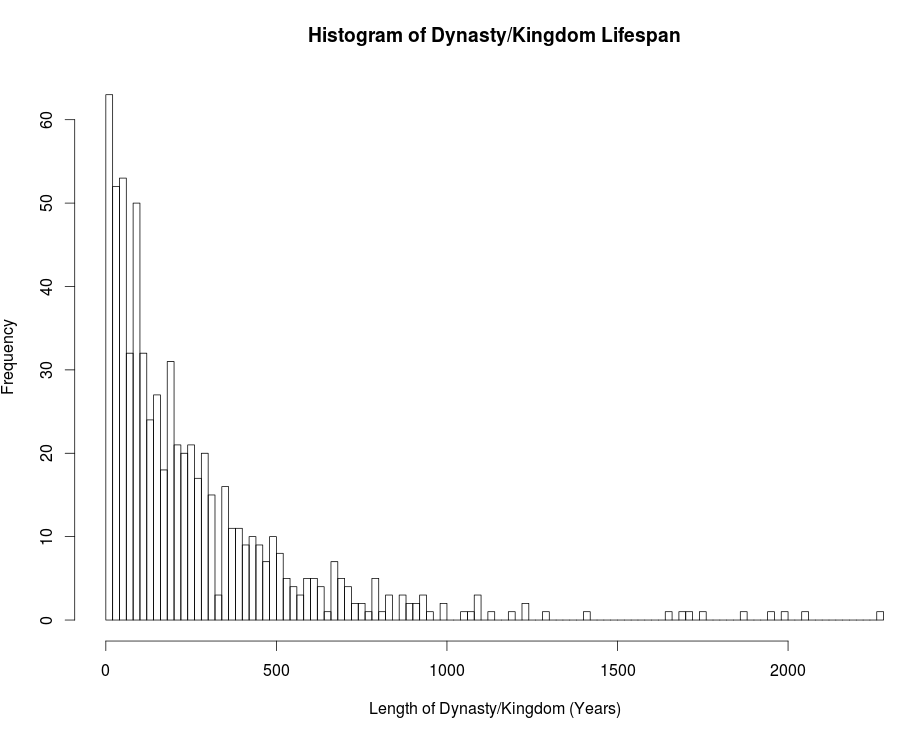
Do there exist studies on the distribution of the lengths of kingdoms and dynasties — distinct political entities — since the 3rd millennium B.C.E.? It seems likely that someone has already studied this topic, but I can not find any papers online. To explain, I have included a file, here, containing the beginning and end dates of about 700 distinct social groups since the dawn of recorded history. It was complied from various Wikipedia pages. I do not doubt that the data is not very reliable, however, graphing the histogram of these lengths, see Figure 1, would provide at least a rough idea of their distribution.
 |
| Figure 1 |
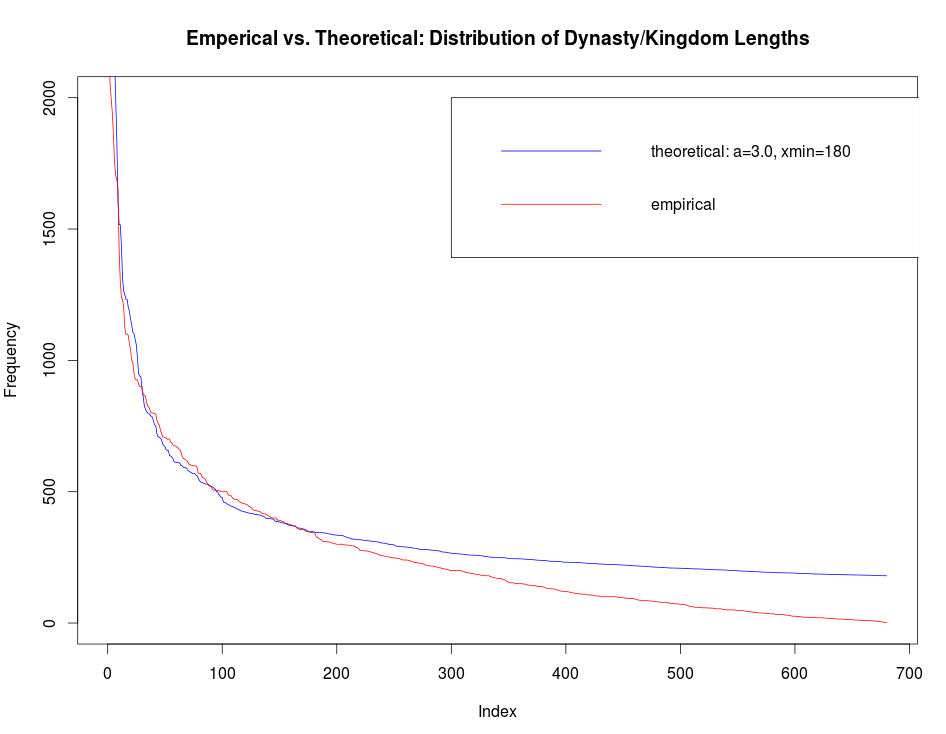
It does seem that a nice distribution curve exists which models the data. The distribution seems to take the shape of a power law at first glance. Doing some work in R, I found that a power law with one set of parameters fits the tail nicely but fails to fit the first half; and vice versa, a power law with a different set of parameters fits the majority but not the tail. My hypothesis is that a power law with alpha equal to 3 may be the best fit. This is a prediction based on the lectures of Geoffrey West, in which he explains that most biological systems exhibit power law distributions with alpha in the 2.5-3.0 range. However, as seen in Figure 2, this does not seem to be the correct range for alpha if a power law is the best fit for this preliminary data.
 |
| Figure 2 |

There are several videos and more information at the Geopolymer Institute.
 |
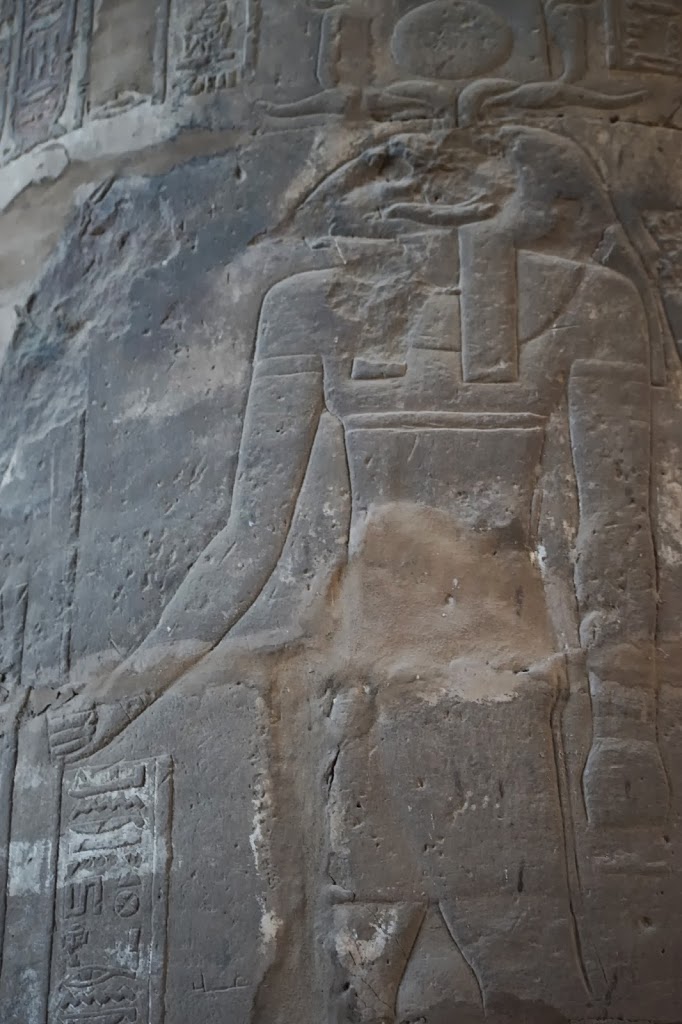
| Khnum |

Eric Cline’s book, 1177 B.C.: The Year Civilization Collapsed, provides a scholarly summary on the rise and decline of the bronze age in the Mediterranean region. Citing a number of different reasons for collapse, I find the most interesting to be a complex systemic failure arising from a continuous wave of natural disasters combined with external attacks by “sea peoples” which the “global” system could not withstand. These shocks were applied to the ancient system at its peak, in terms of power and interconnectedness, which indicates that collapses seem to occur near peaks, not troughs, in societal wealth and prosperity. And several civilizations tend to disappear at the same time; much as species extinction tends to occur in clusters. Chinese dynasties, Mesopotamian cities, Persian kings, the Mongols, the Romans and countless other examples show the same pattern.


