Scale, by Geoffrey West, is a thought provoking book about coarse grained quantitative network theories which concern the entire human species and its interaction with the environment. Although verbose — as I think the intended audience is upper high school and entry-level college — it is clear in its depictions and explanations. This book is an important summary of really profound work and research performed at the Santa Fe Institute. And it is a great introduction to understanding power laws and scaling in biology and network topologies.
Category: didier sornette (Page 1 of 3)

Volume 1 – Capital: Critique of Political Economy
Volume 2 – Capital: The Process of Circulation of Capital
Volume 3 – Capital: The Process of Capitalist Production as a Whole
Ebook and PDF versions: here and here
Also, for some lectures and commentary on the book see David Harvey’s website.
Possible conception for The Organism which Marx refers to:

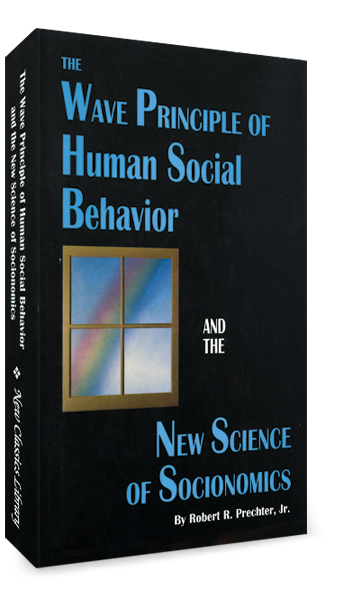
I posted before about the Elliott Wave Principle and several books dealing with the subject. However, I feel the need to reiterate the importance of two books by Robert R. Prechter, Jr. They are: The Wave Principle of Human Social Behavior and Pioneering Studies in Socionomics. I purchased both these books in a two volume collection called, Socionomics: The Science of History and Social Prediction. In all my studies as an undergraduate and graduate student in the field of finance and mathematics, not one professor has ever mentioned Prechter or Elliott.

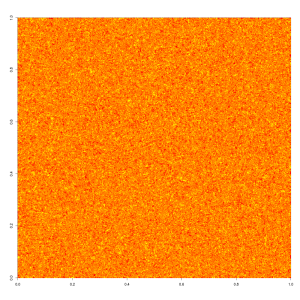
I am currently exploring stock price movements. I hope to publish a full post on my insights soon. Perhaps linking Elliott Waves with the fundamental tug-of-war between buy and sell price action. Here is a neat simulation of traders in an Ising type model. The resulting stock price simulation can be seen in the PDF. The model was created using 1,000,000 traders. If this is really the underlying nature of the movement of stock prices, then by observing a stock trajectory, an observer is really only getting a tiny fraction of the information about the state of the system. If there was a way to implement this model on a wide scale, the results would be really neat.
Red dots are traders short the stock. Yellow dots are traders long the stock. Orange dots are traders neither short nor long the stock.
I recently created a new blog, called LPPL Market Watch, for my research on LPPL Oscillations in the stock market.
Update June 2013: The Bubble Index


