An Autonomous Agent

exploring the noosphere

Page 28 of 75

Secret Universe: Journey Inside the Cell (2012)

With computer graphics we can now see an invisible world, the result of billions of years of evolutionary interaction. This vast expanse of time created the truly magnificent complexity of life. Secret Universe: Journey Inside the Cell provides a remarkable graphic visualization of this complexity. The processes of cellular function are slowed down and magnified so that viewers can see and understand the continuous activity occurring within their own bodies. It is simply stunning to realize what is happening in the microscopic world of the cell.

Also called: Secret Universe The Hidden Life of a Cell
Watch it: Hulu, Dailymotion, YouTube

Think of the Earth as a human cell; the human body would stretch the length of Jupiter’s orbit around the Sun.

Approximate Diameter of Earth: 12,742 km

Average Diameter of Jupiter Orbit: 1,557,094,400 km (122,201.7 times Earth’s Diameter)

Approximate Diameter of Human Cell: 15 micrometers

Average Height of Human: 1.8 meters (120,000.0 times the Diameter of Human Cell)
Time Lapse of the City of Boston – Bodhi Films

This post is a mixture of art and science. Love this video – not just for the special effects, but for the perspective it gives the viewers. It helps to visually see how a city functions and operates. Some scenes provide a sort of visual omniscience.


This is Boston from Bodhi Films on Vimeo.

Sander van der Leeuw – Can the Distant Past Teach Us About Modern Crisis?

Sander van der Leeuw, from Arizona State University and the Santa Fe Institute,  discusses anthropology and how modern society has much to learn from its own past. Great presentation, I highly recommend.

Fora.tv:
Can the Distant Past Teach Us About Modern Crisis?
Podcast:
Can the Distant Past Teach Us About Modern Crisis?

The importance of the city and its function in society plays an important role in the 21st century. Understanding its development and future will provide key insights to capital flows and societal change. Sander van der Leeuw quickly outlines these details in the follow videos:

D3 Data Driven Documents

A friend told me about D3 Data Driven Documents. This is an excellent site for anyone with a desire to display data in a unique and cool fashion on the internet. I will be updating my site, thebubbleindex.com with D3 js methods soon.

Thoughts About a Project and GPUs

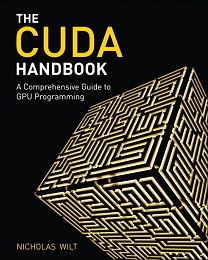
I want to do something which combines GPU programming, finance, and/or conservation — something which will help the relationship between humans and the environment. There are a few ideas in my head. One is about displaying data with 3D graphics to give traders more than just a ticker price. The price of a security is a minimal form of information. What is a good method to display the daily progression of trade volume? Most information about short sells, margin levels, and ownership levels are hidden; revealed only on a monthly or quarterly basis. This infrequent update hinders the development and understanding of crash prevention. Combining all of this information into a visual display based on an Ising model (example) and N-Body particle simulation should be informative. Of course I am simply speculating and putting thoughts into words. The two books I am currently browsing through are: OpenCL in Action by Matthew Scarpino and CUDA Handbook: A Comprehensive Guide to GPU Programming by Nicholas Wilt.

CUDA Samples:

Page 28 of 75

Become a Friend of GNOME [ GNU Link] kde-user

Powered by WordPress & Theme by Anders Norén